안녕하세요! 오늘은 케라스를 이용해 Iris data를 분류해도록 하겠습니다!!
**********주의**********
R에서 Keras를 돌리기 위해서는 아나콘다가 설치되어 있어야 하며,
아나콘다에서 tensorflow가 설치되어 있어야 합니다.
R의 콘솔에는 install.packages("keras") 뿐만 아니라
library(keras)
install_keras()
이 순서대로 실행시키고, 에러없이 설치가 되어야 합니다.
코드에서 쌓은 레이어는 총 3개이며, 각각은 relu를 activation 함수로 취했습니다.
optimizer는 rmsprop으로 했습니다!
전체 코드는 맨 마지막에 있습니다.
R에서 케라스를 돌릴 때, 주의해야 할 점은
"input 형태 다듬어주기"입니다.
1. 종속변수는 숫자로 표현이 되어야 합니다.
factor형이 아니라, integer형으로 바꿔주셔야 합니다.
2. keras는 input형태를 metrix나 arrray로 받습니다.
dataframe을 넣으면 안돌아갑니다. 따라서 행렬의 형태로 바꿔줘야 합니다.
3. 라벨은 따로 x_test, y_test로 떼어주기
R의 keras는 R보다는 파이썬에 가깝습니다.
따라서, 기존에 R에서 train과 test를 나누는 방법과 다소 다릅니다.
r에서는 단순히 train과 test로 데이터를 나누고 종속변수를 지정해 주면 알아서 학습합니다.
하지만, keras에서는 label을 따로 떼어내어야합니다.
그리고 그 label에 해당 하는 값들을 one-hot인코딩을 해주어야 합니다.
전체 코드
library(dplyr)
library(keras)
library(caret)
rm(list=ls())
data(iris)
#종속변수를 숫자로 만들어주기
iris$Species = ifelse(iris$Species=='setosa',0,ifelse(iris$Species=='versicolor',1,2))
#train test 데이터 분할
index <- createDataPartition(y = iris$Species, p = 0.7, list =FALSE)
train = iris[index,]
test = iris[-index,]
#########케라스 input형식 맞춰주기
x_train <- train[,1:4]
y_train <- train$Species
x_test <- test[,1:4]
y_test <- test$Species
y_train=to_categorical(y_train)
y_test=to_categorical(y_test)
x_train = data.matrix(x_train, rownames.force = NA)
x_test = data.matrix(x_test, rownames.force = NA)
dim(x_train);dim(y_train)
dim(x_test);dim(y_test)
##########모델 만들기
model <- keras_model_sequential() %>%
layer_dense(units = 16, activation = "relu", input_shape = ncol(x_train)) %>%
layer_dense(units = 16, activation = "relu") %>%
layer_dense(units = ncol(y_train), activation = "softmax")
model %>% compile(
optimizer = "rmsprop",
loss = "categorical_crossentropy",
metrics = c("accuracy")
)
summary(model)
#############모델 적합
history <- model %>% fit(
x_train, y_train,
callback= callback_tensorboard(log_dir ="logs/run_b"),
epochs = 50, batch_size = 128
)
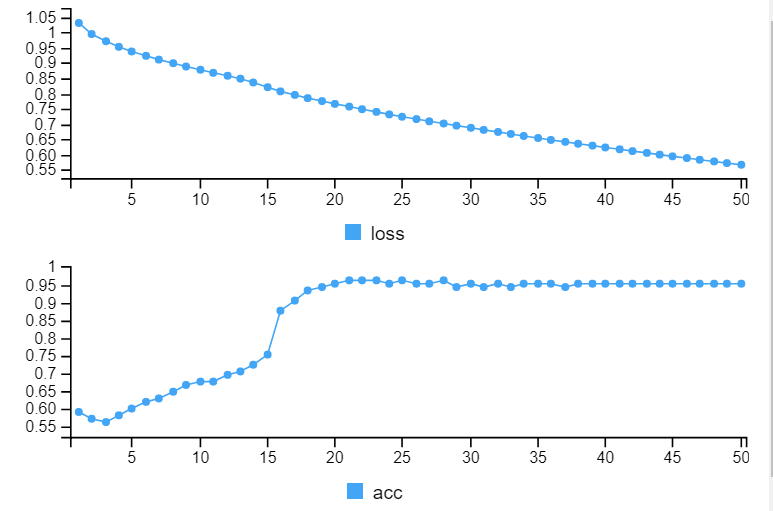
plot(history)
#############train에 적용
result1=model %>% evaluate(x_train, y_train)
result1
###############test에 적용
result2=model %>% evaluate(x_test, y_test)
result2
결과는 다음과 같습니다.
loss는 떨어지고 accurarcy는 올라가는 것을 볼 수 있습니다.
x축은 epoch입니다.
epoch이 지날 수록 더 정확해지고 있음을 알수 있습니다.
최종 accuracy입니다.
약 98%의 정확도로 iris 데이터를 잘 분류했음을 알 수 있습니다.

'R' 카테고리의 다른 글
| [머신러닝] KNN(최근접이웃) in R (0) | 2019.06.15 |
|---|---|
| [R] R Studio가 갑자기 느려질 때 (0) | 2019.06.11 |
| [R] 데이터 불러오기 (0) | 2019.05.29 |
| [R]ggplot2에 대해 파헤쳐 보자!!(feat.실전편) (0) | 2019.05.24 |
| [R]ggplot2에 대해 파헤쳐 보자!!(feat.심화편) (0) | 2019.05.23 |


